Connect your data sources
Briefer can connect to your databases so you can use real data in your pages. You can connect to your data sources by clicking on the “Data sources” button on the bottom left corner of the interface.
Create your first page
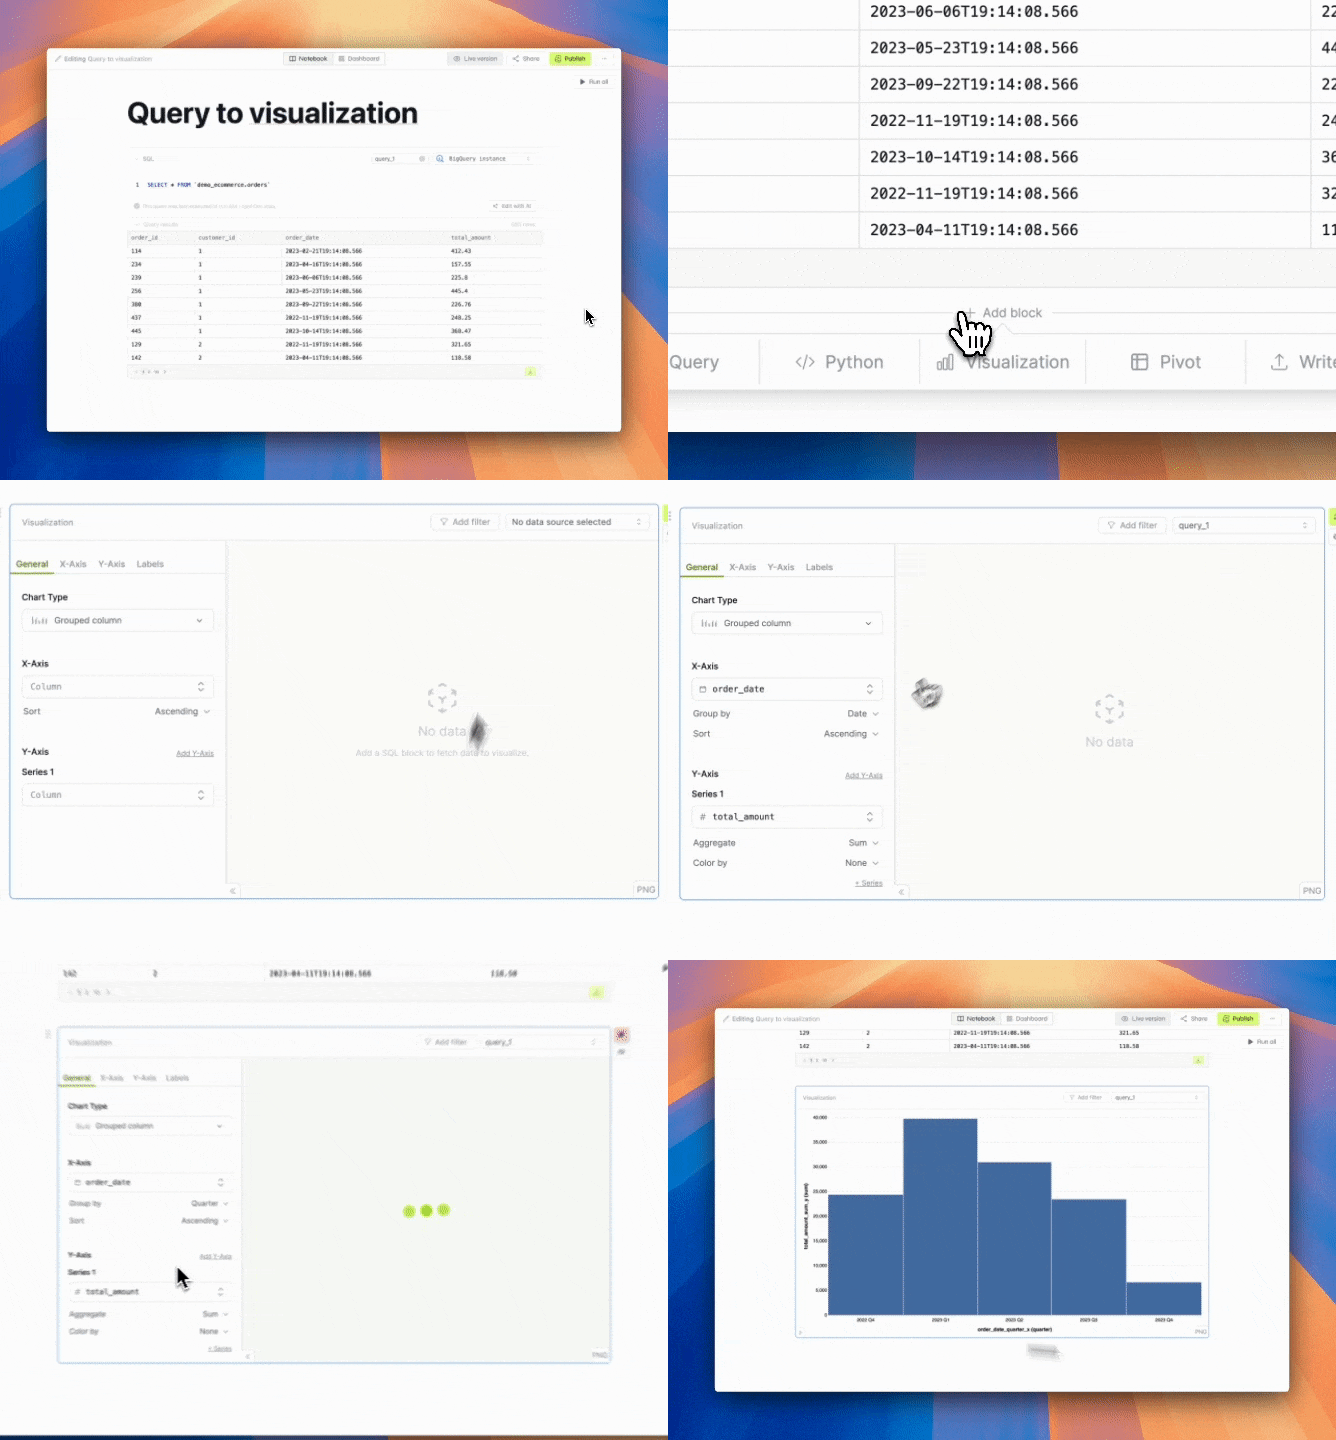
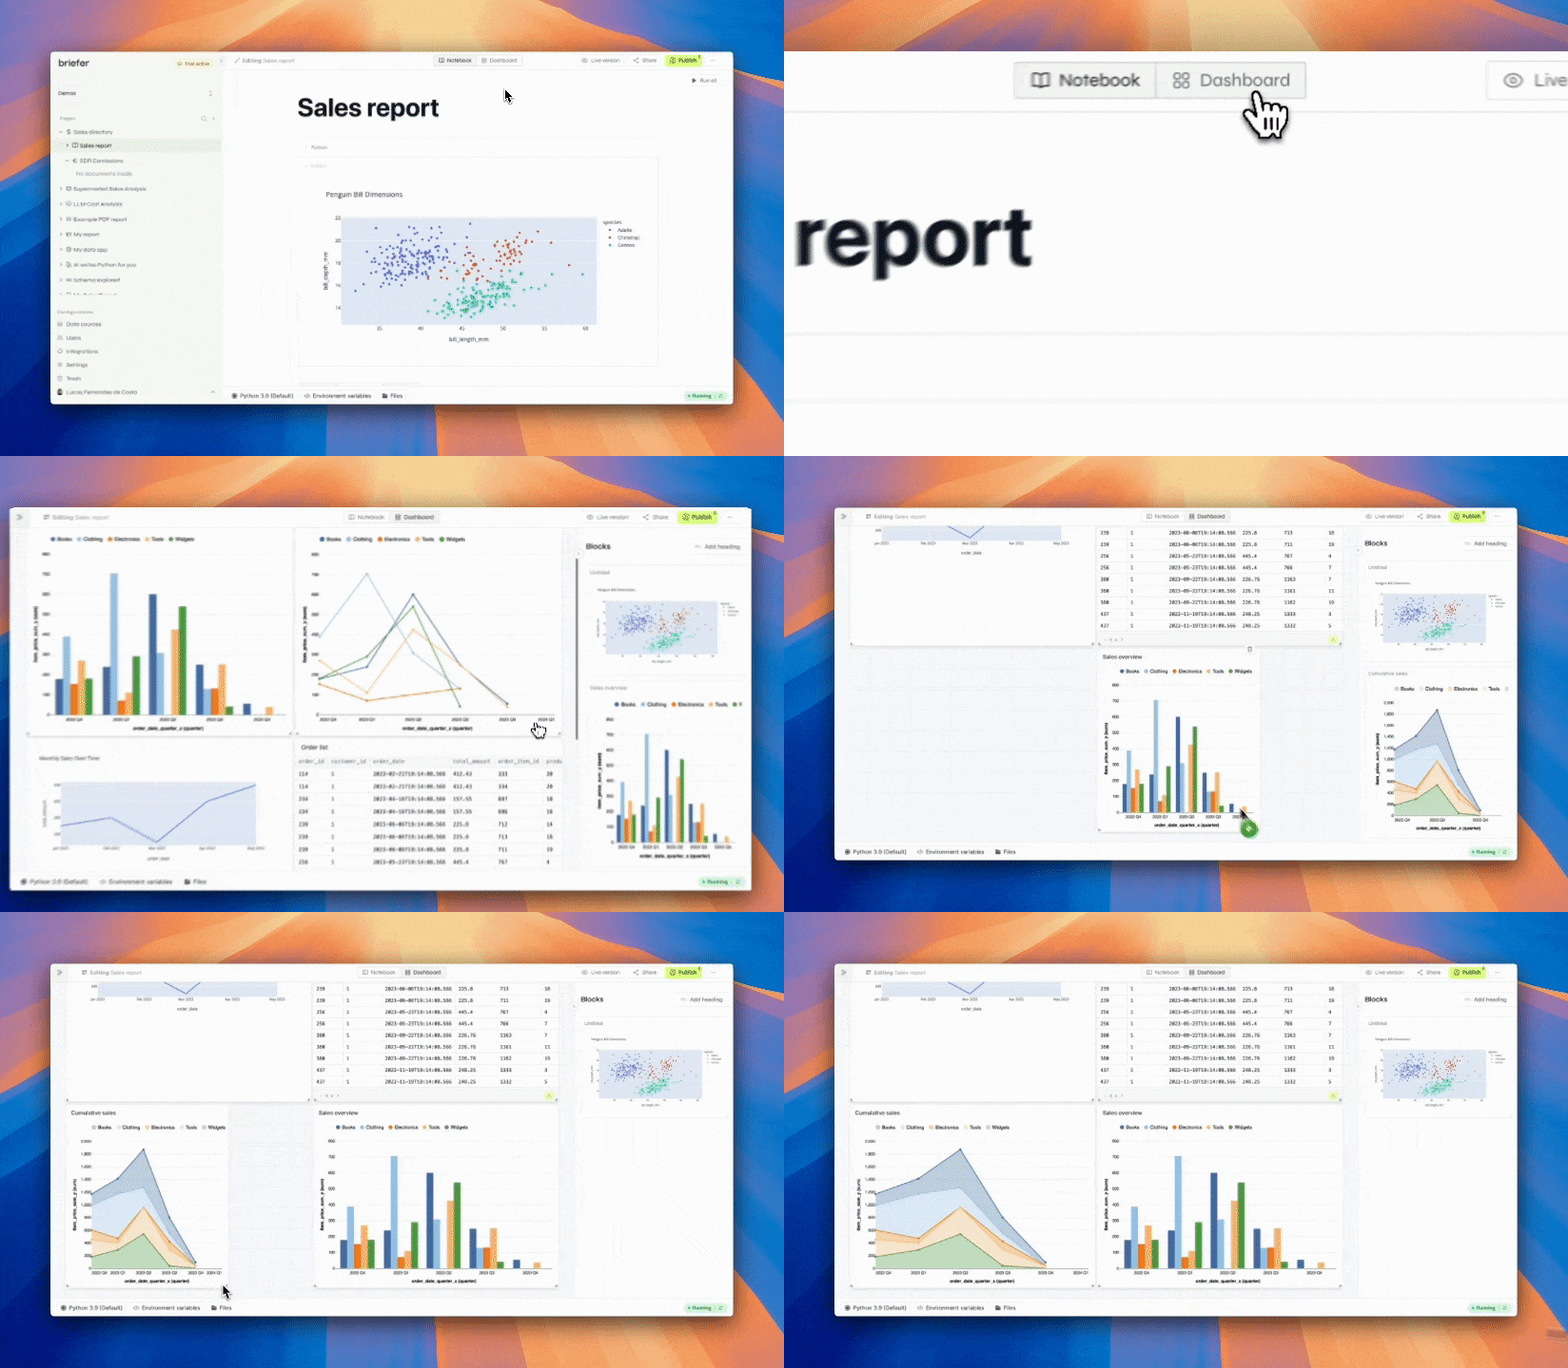
Use Python, SQL, or point-and-click visualizations to create your first page. After creating your first page using the notebook view, you can switch to the dashboard view and drag and drop your blocks into it.
1. Connecting a data source
You can connect to your data sources by clicking on the “Data sources” button on the bottom left corner of the interface. Then, click on the “Add data source” button to add a new data source connection. Briefer supports a variety of data sources, including:- PostgreSQL
- BigQuery
- Redshift
- MySQL
- SQL Server
- Snowflake

2. Creating your first page
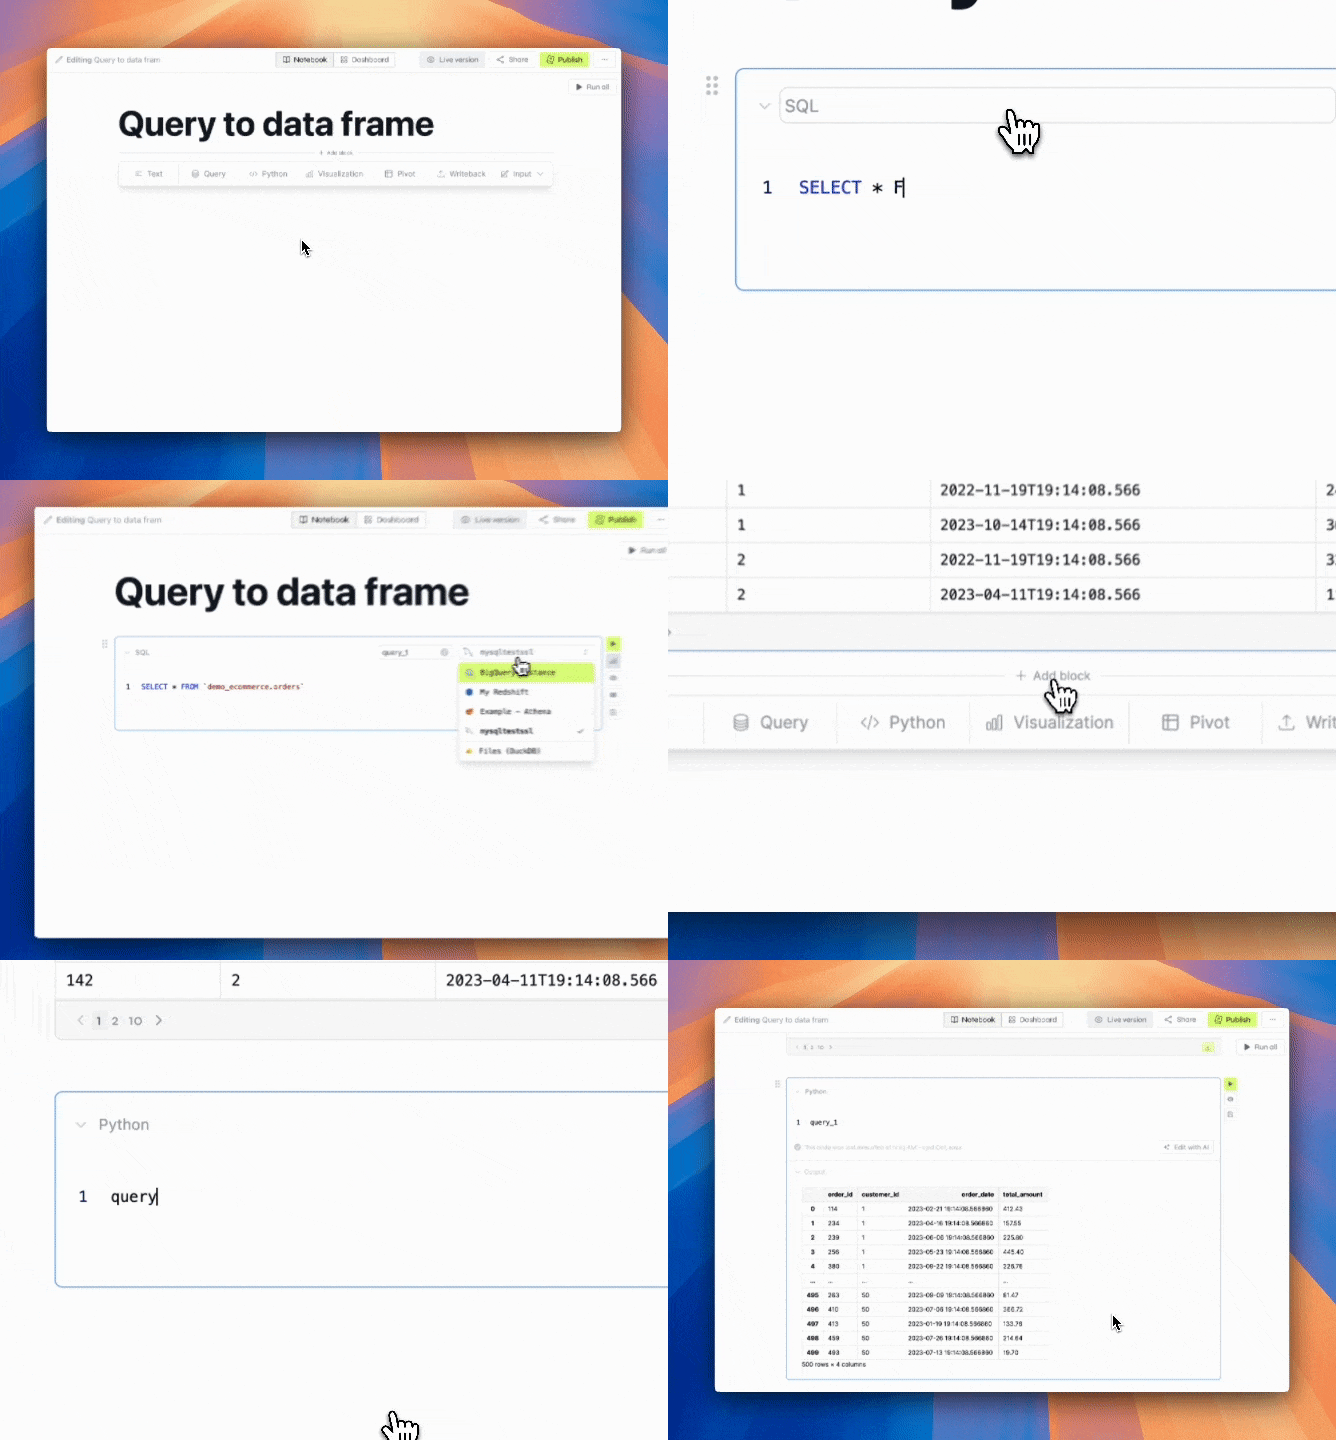
Click the plus icon that appears next to “Pages” on the left sidebar to create a new page. You can then add blocks to your page by clicking the “add block” button that appears when you hover over the gaps between blocks. We recommend that you start with a query block to fetch some data from your data source. Then, you can use that query’s result in your Python blocks by using the variable name that appears on the top of the query block, as shown in the example below.


3. Inviting your team
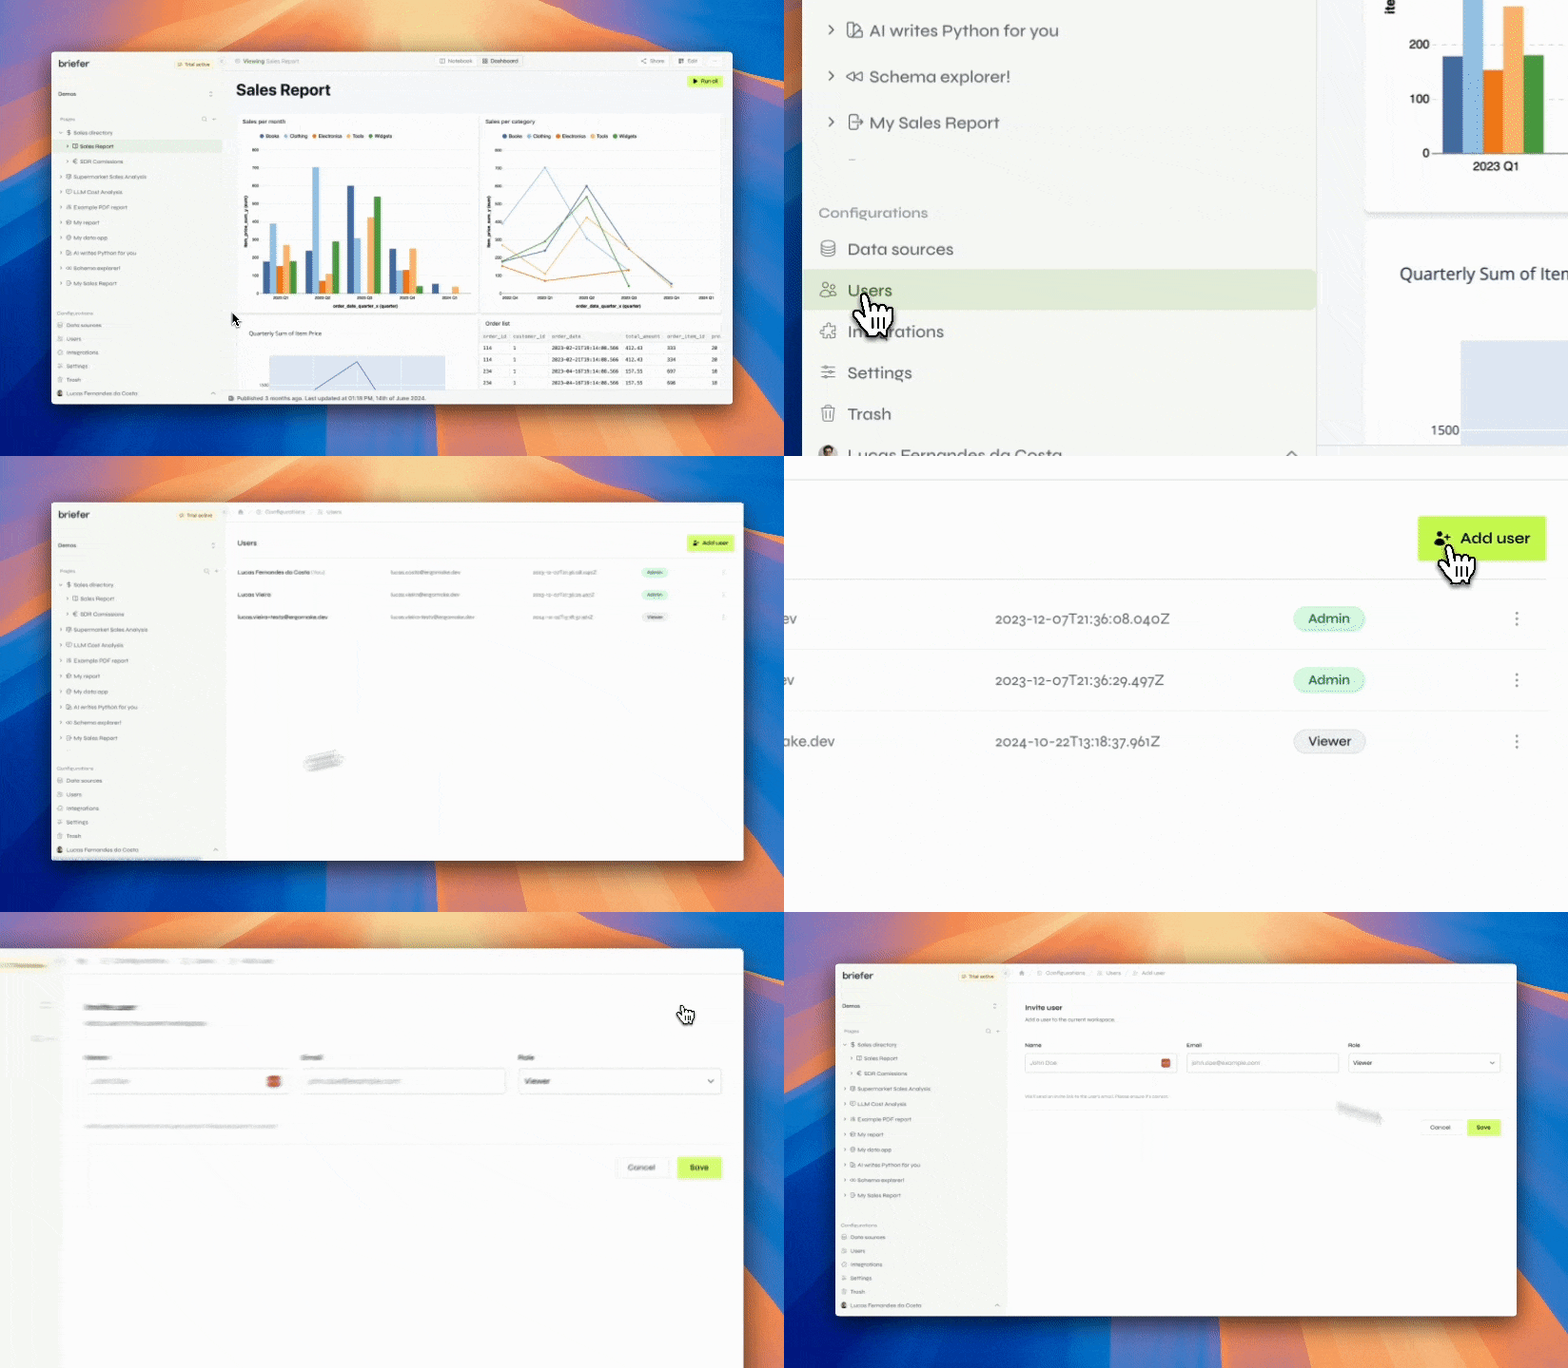
After creating your first page, you can invite your team to see your work and collaborate with you. You can invite your team by clicking on the “Users” menu on the bottom left corner of the interface. Then, click the “Add user” button on the top right corner of the users list to invite a new user.
For more details about user management and permissions, check out the user management page.
4. Where to go from here
After completing these steps, we recommend that you explore other features of Briefer, such as:- Files: for uploading files to Briefer and using them in your pages.
- Input blocks: for adding text inputs, dropdowns, and date pickers to your pages.
- Schedules: for running and updating your pages periodically.
- Environment variables: for storing sensitive information like API keys and database passwords and using those values in your pages.
- Snapshots: for seeing how your pages evolved over time and restoring them to a previous state.
- Schema explorer: for exploring your database’s schema and data.